“Team, we need to increase the speed by which Design delivers on usefulness, usability, and delight while maintaining our very high visual design bar.”
Key Outcomes:
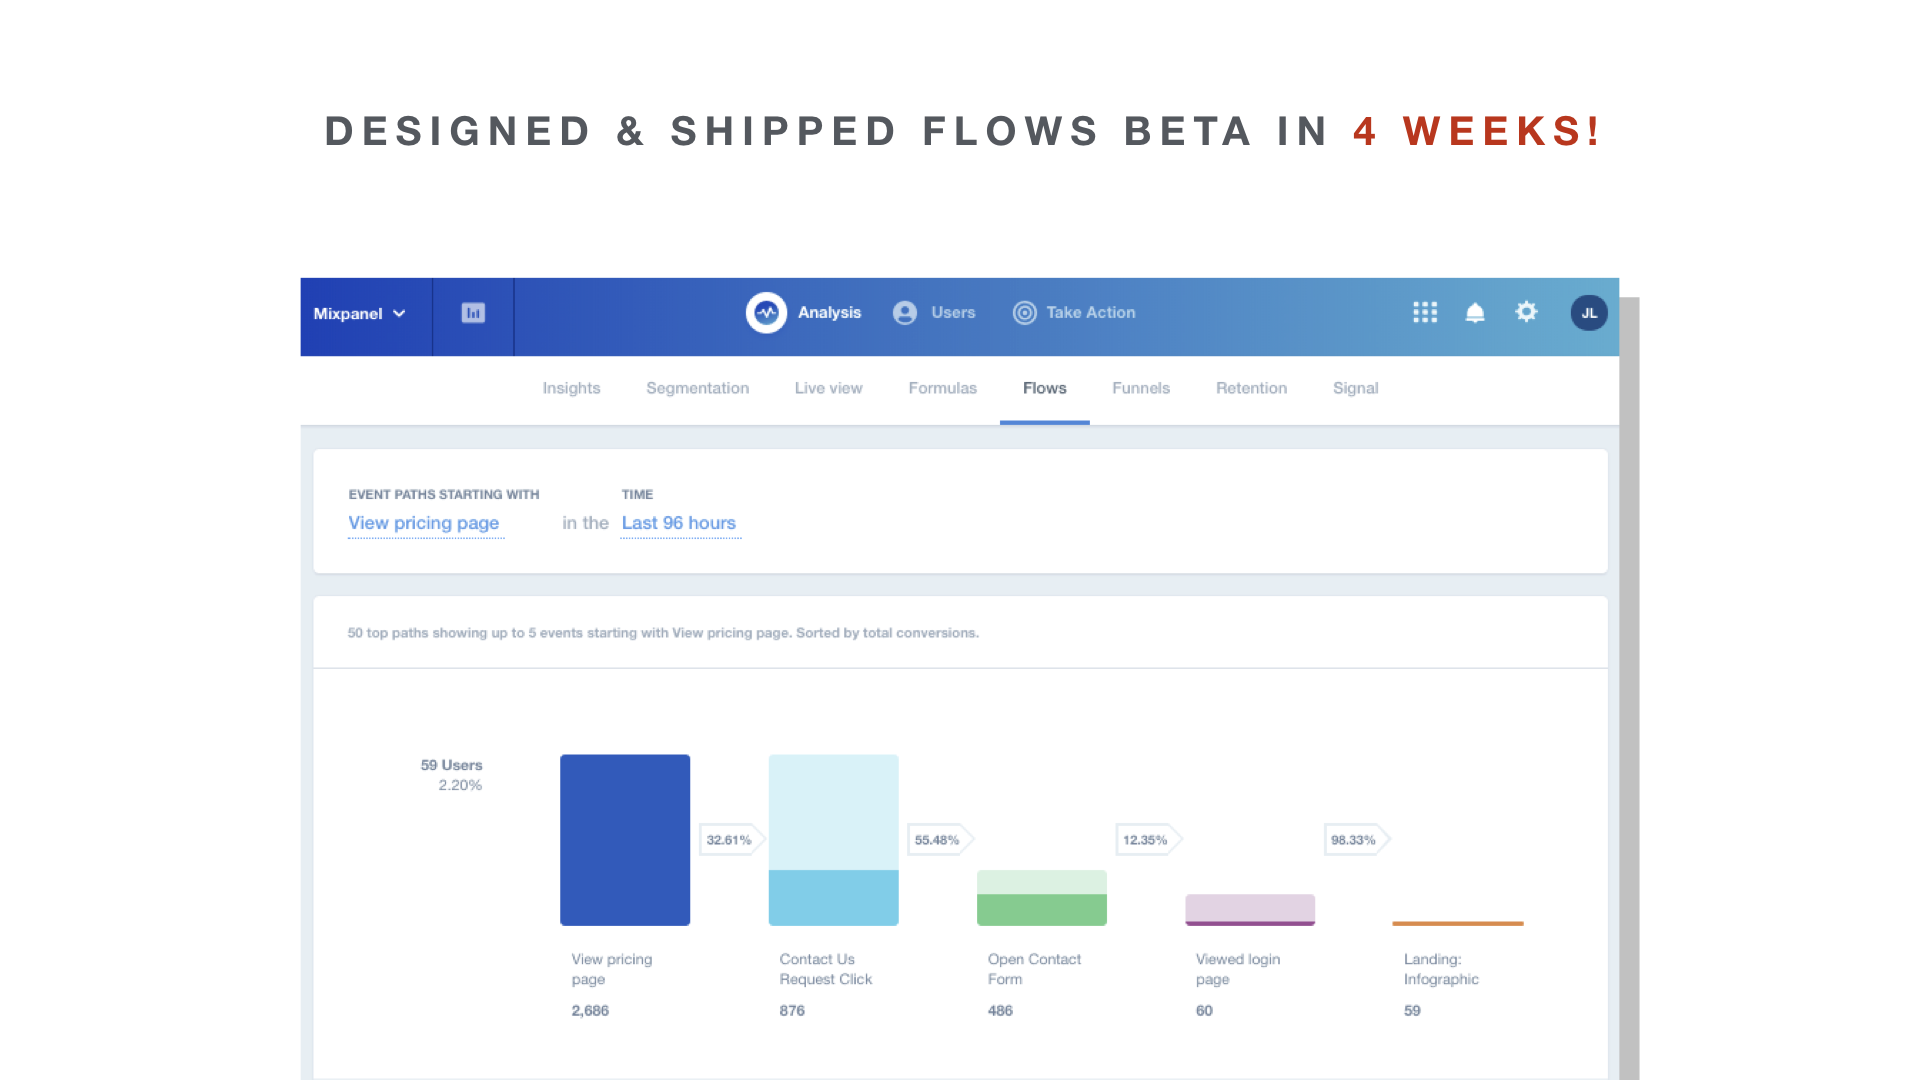
Shipped Flows MVP's in 4.5 weeks
Reduced engineering risk through validation cycles
Increased velocity of team by ~50% in 1 quarter
My Role:
Role: Design Lead Manager
Reported to: CEO, Founder
My Team:
Andriy Dadyura, Visual Design Lead
Mike Casebolt, Design Lead
Giulliano Chacha, Communications Designer
Alex Coleman, Design Lead
Ryan Davis, Visual Designer
Nicole Jiang, Product Designer
Jeff Jorgensen, Design Lead
Erik Levitch, Design Lead
Eric Lobdel, System Designer
Mancy Mau, Product Designer
Rakhi Parekh, Design Lead
Julien Renvoye, Design Lead
Mason Yarnell, Design Lead
Duration:
Start: August 2017
End: May 2018 All-Hands Announcement
The Problem
When I first started managing the design team at Mixpanel, there were many obstacles to delivering successful solutions quickly. Some of these obstacles existed within the team, but many required negotiation with the rest of the organization. At a high level, they included:
- Lack of a customer's-problem-centric design process
- Date-driven scope setting that disregarded outcomes
- Meager customer participation, user testing, or beta protocols
- Misperceptions of "Design" and UX Research
- Lack of design overlap with PM's and Engineers
I came to this conclusion after spending the first six weeks to 3 months understanding how decisions were made, the current and desired processes, product strategy relative to business strategy and, most importantly, the dynamics of the relationships between design and the rest of the organization.
We celebrated success at the May 2018 EPD offsite where leadership announced to the entire company that Design would officially own the Solution Space, as validated by customer feedback. The many steps necessary to make this happen are summarized below.
Here is a year’s journey to that success:
“Customer Success owns the customer relationship. They get nervous if designers are too involved with them. ”

Branding explorations of the Mixpanel Visionary Partners design work by Mike Casebolt


Mixpanel Visionary Customer workshop
The slide that I used to socialize the benefit of consolidating our customer feedback and integrating customers into the design process.
Generating Cross-Functional Buy In
One of the first challenges I encountered when trying to set up a proper usability testing process for designers was the territorial nature by which customer relationships were governed. This is understandable in an enterprise/SaaS sales environment where “churn avoidance” is part of everyone’s vocabulary, but it was crippling for design to be so isolated from our most valuable players, our biggest clients.
Working across Customer Success, Support, Sales, Marketing, and the rest of the EPD organization, I refined our collaboration into a program we named, Mixpanel Visionary Partners, or “Visionaries” for short. Codifying the process by which we could engage our most enthusiastic customers early in the design process, as well as for validation, gave us an instrument to break down the barriers between the customer-facing factions of the company and align them with the success metrics of the Product teams.
“That description of “Product Designer” sounds too much like a PM. What’s wrong with just having designers deliver the requirements requested? ”

The slide I used at all-hands to discuss how human-centered design, and Design’s ownership of the solution space, required participation from everyone in the company.

Chart used to visualize alignment of Design’s scope of contribution with Engineering leader’s expectations.
Advocating for Ownership
If there is one thing I believe in more than anything else, it is the linear relationship between “ownership” and quality of outcome for design success. The clearer the line of sight from a customer’s problem to what “success” would mean if it was solved, and full autonomy to get there as fast as possible, the happier the customer. It is that simple in my mind.
We did not have this.
Getting permission to expand the scope of Design’s contribution from visual assets to strategic recommendations would be the most significant of all efforts. This required generating alignment and buy-in with eight Technology Lead Managers, VP’s, PM’s, and existing designers who were not accustomed to contributing strategically. That's quite the multi-varied equation. It took some time, but we did it. Small victories that helps us achieve this include:
Redefining “Designer” to be the “facilitator of the problem solving process.”
Changing how we hired senior design leadership including the rubrics and on-site processes
Defining clear entry criteria and exit criteria for design’s scope
The net effect of this change was meant to impact not only the increase in quality of our customer’s product experiences, but the happiness of of the IC’s responsible for those experiences. I’m happy to report that the first signs of success for the latter are already surfacing.
With regards to Design’s ownership of of the solution space, I was happy to see our Director of Engineering enthusiastically announce to the EPD org in May 2018 that this was the way for Mixpanel to move forward.
“We need to recruit fast to build a design organization that can scale from six to twenty-plus to keep pace with engineering. ”
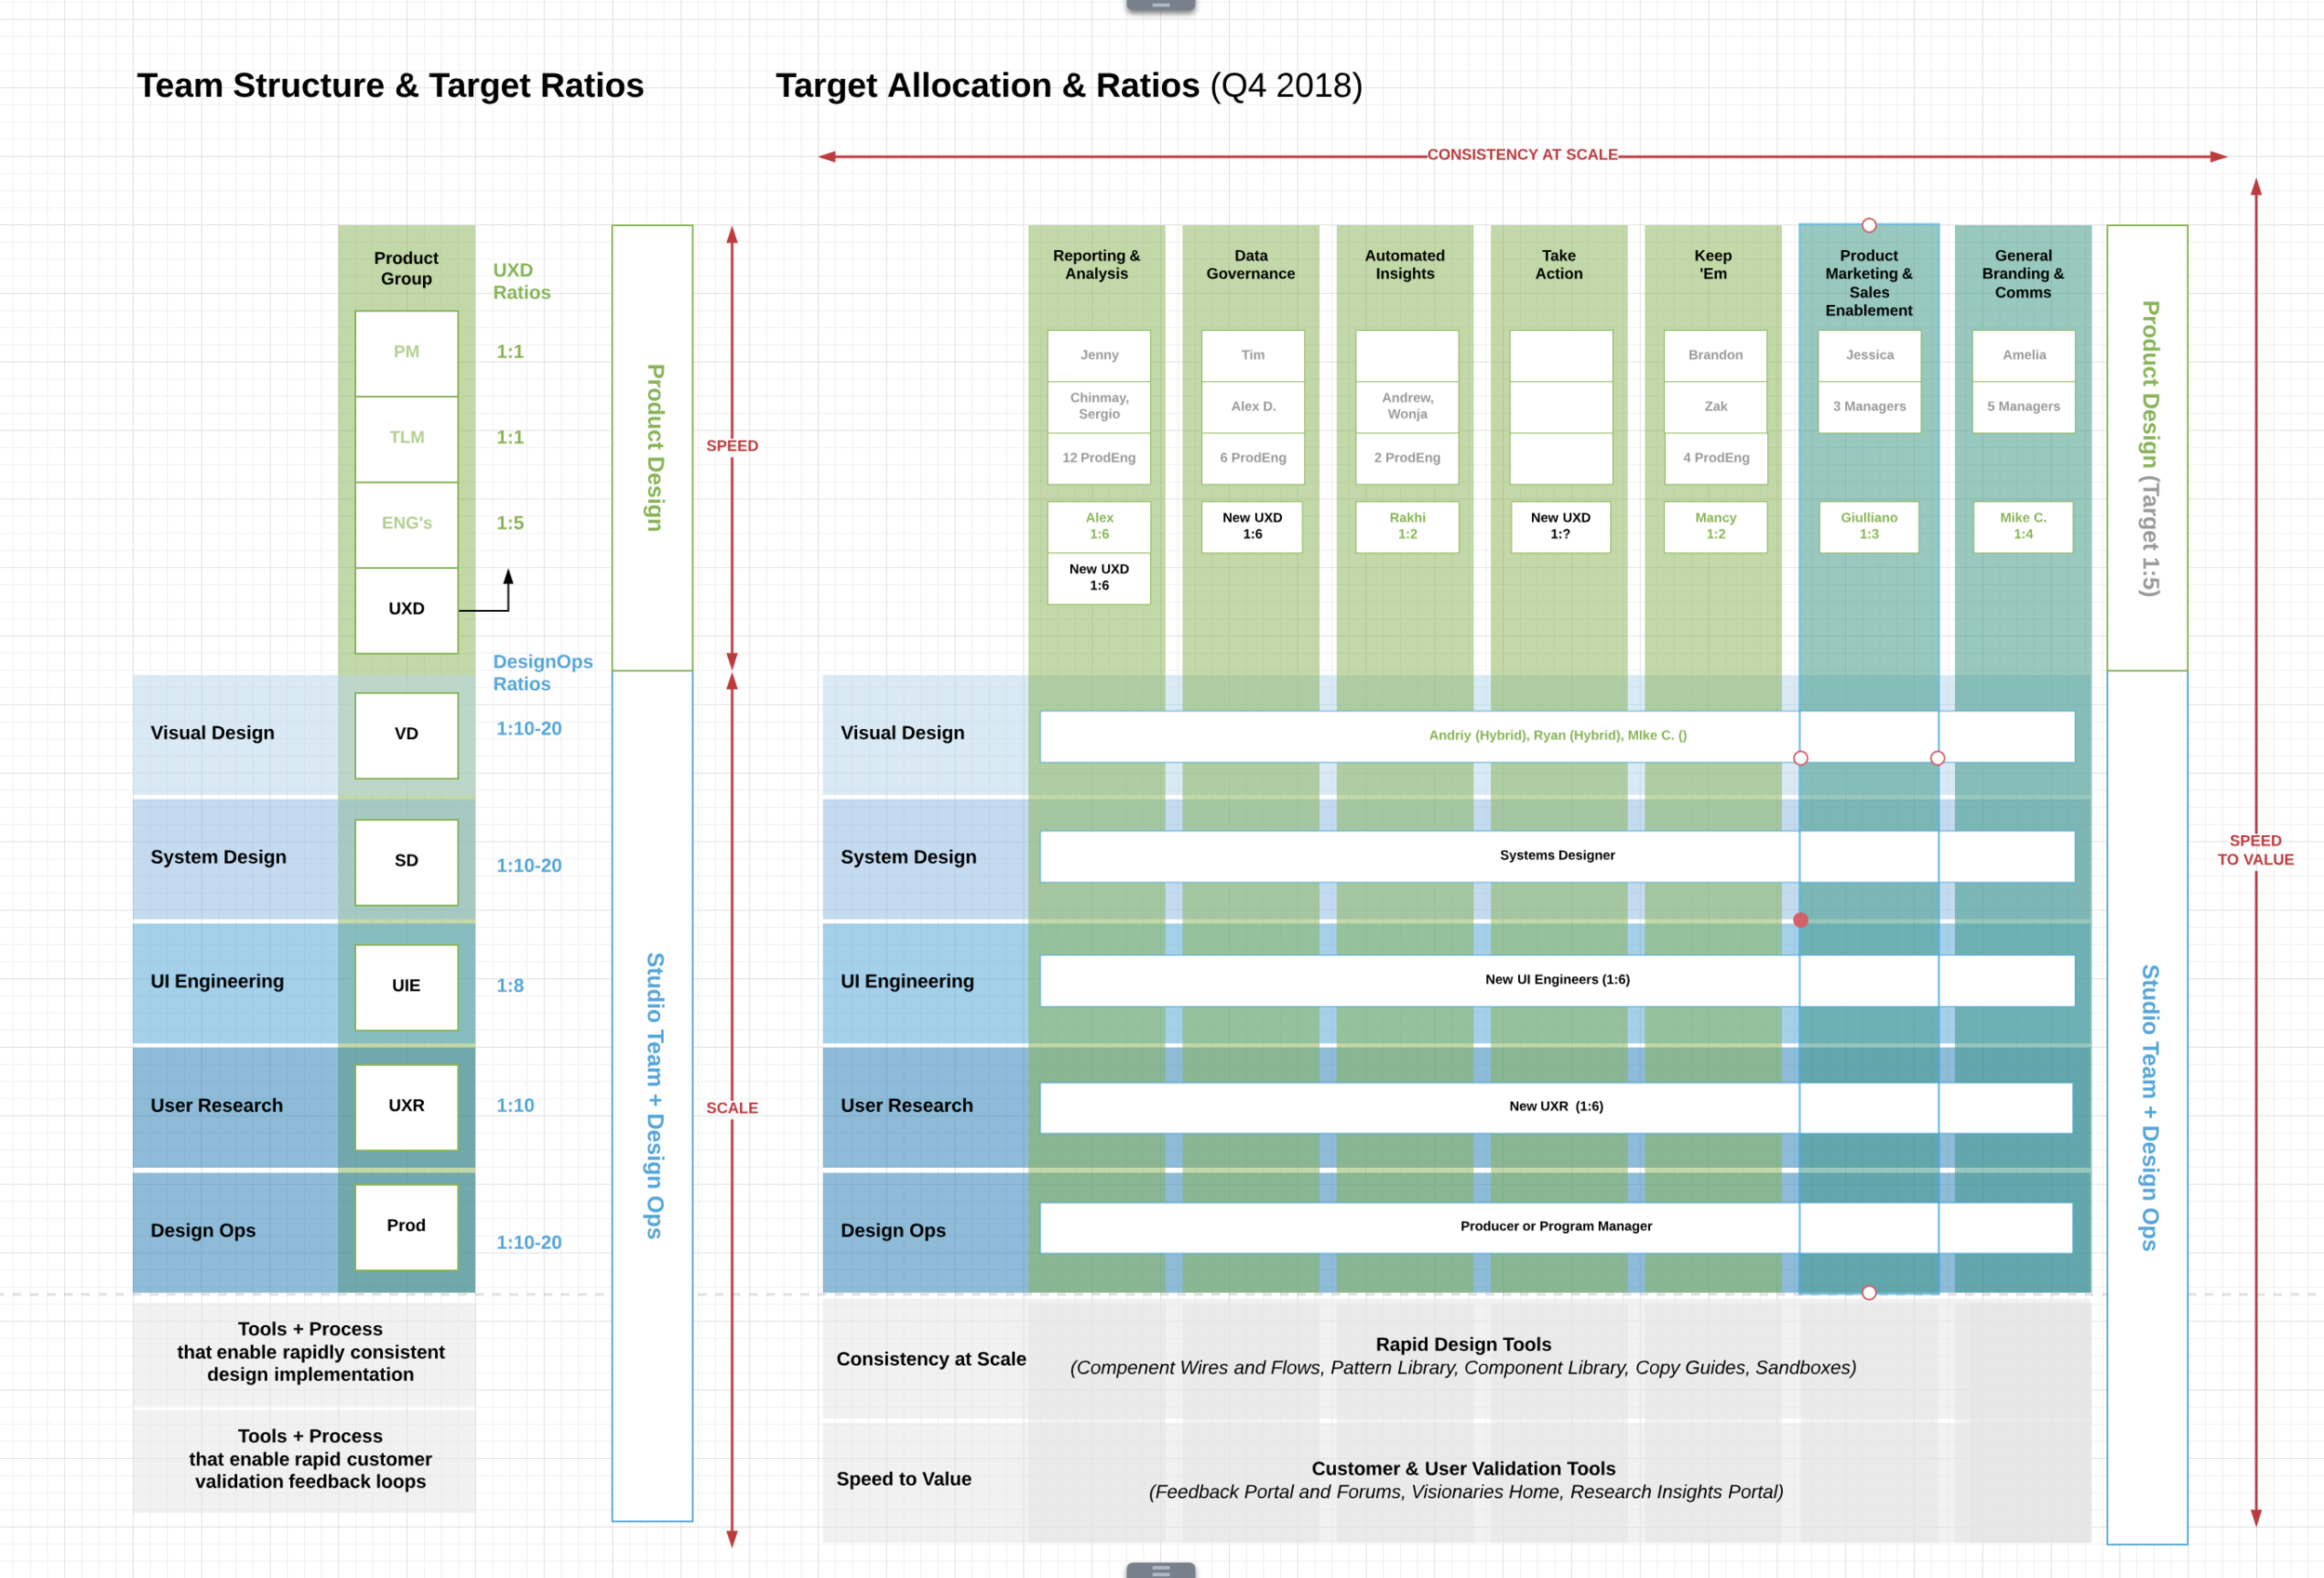
My recommended structure to take the entire design team, including the communications designers, to twenty or more.
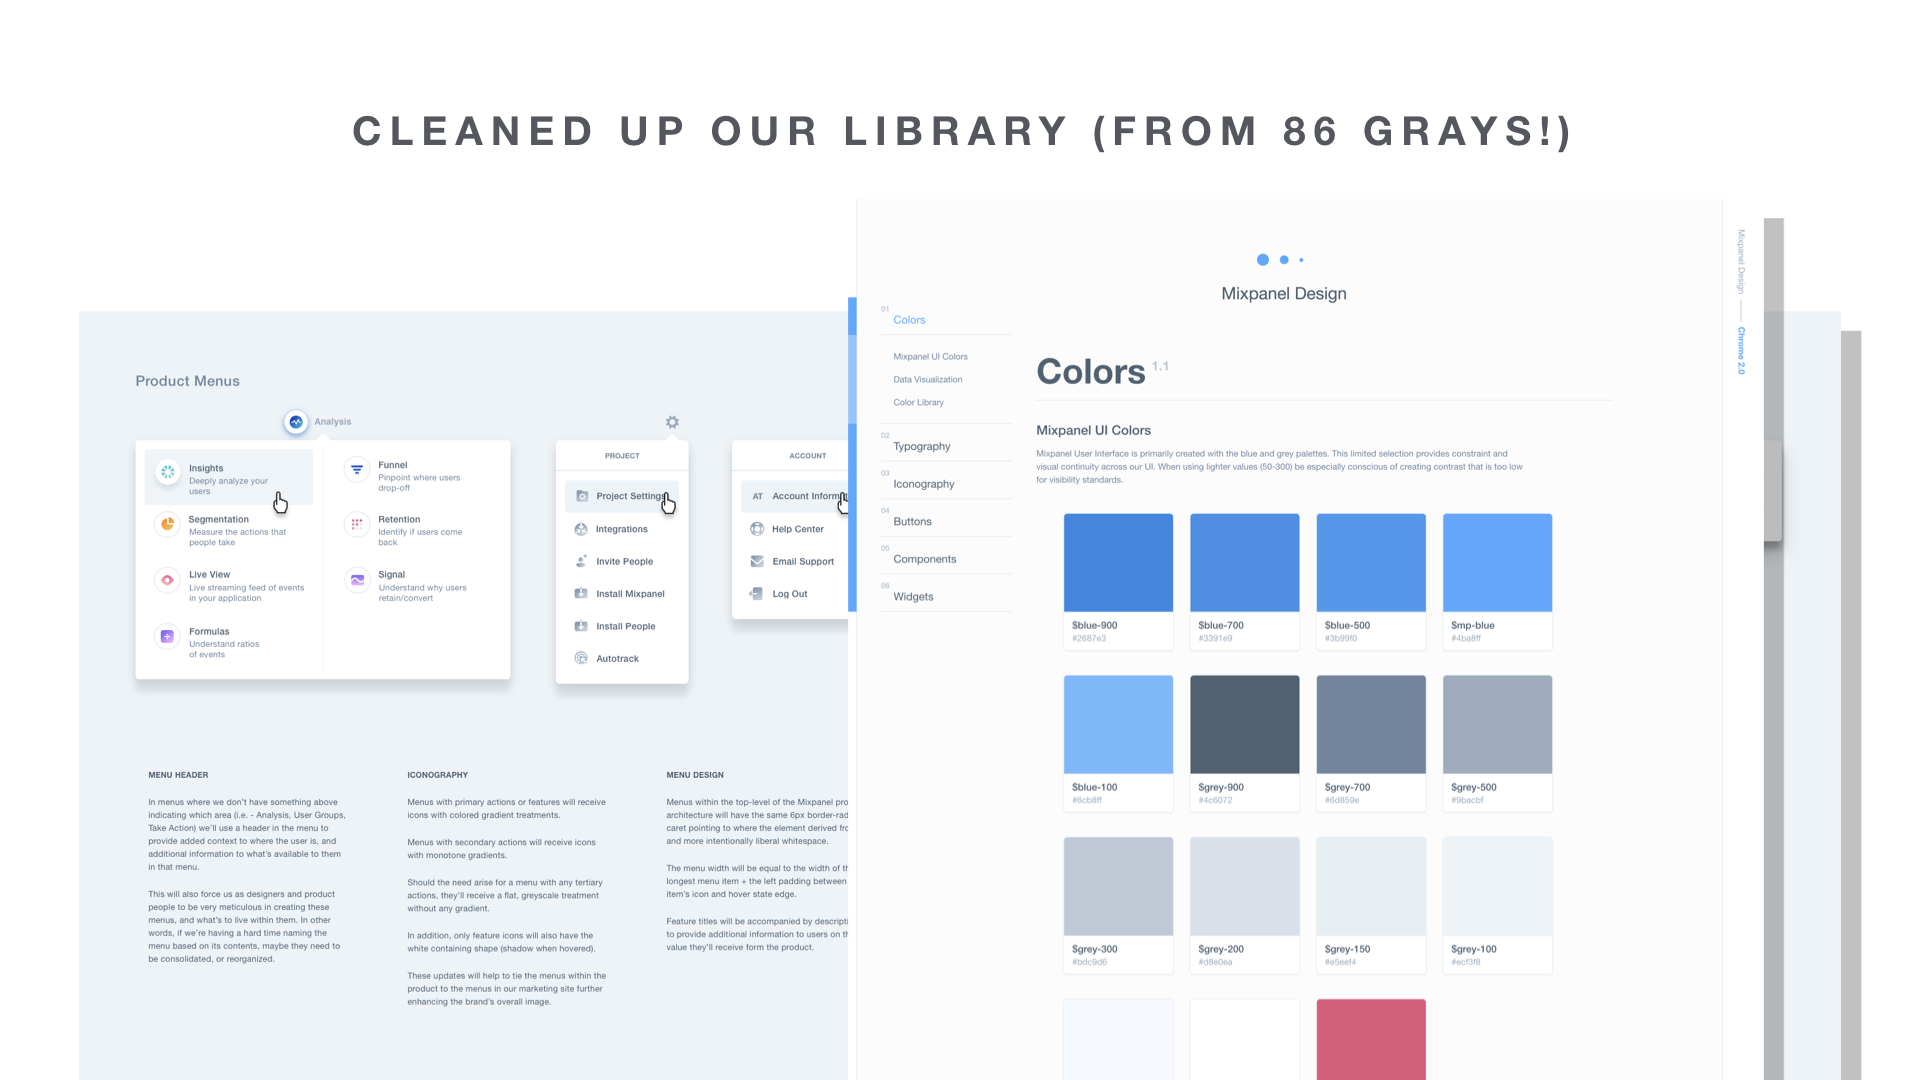
Maintaining consistency and quality at scale.
In order to prepare the team to scale from six designers to somewhere between twenty and forty, we needed a revised model. We needed a model that would support the high bar for visual design while allowing us to recruit quickly for much needed strategic designers in a very competitive San Francisco market.
My recommendation that was approved by leadership was to break out a Studio Team focused on Consistency at Scale. to focus on horizontal contributions with ratios per each vertically aligned Lead UX Designer. Horizontal roles were dedicated to; System Design (1:20+), Visual Design (1:12), Research (1:5), Design Technology (1:5), and DesignOps (1:10). The Studio Team also included Comms designers who wished to do more product design which was a great way to build solidarity.
This allowed us to take advantage of more T-Shaped IC’s focus on problem-solving, org diplomacy and supporting their PM’s. Doing so cleared a path for them to deliver true Speed-to-Value.
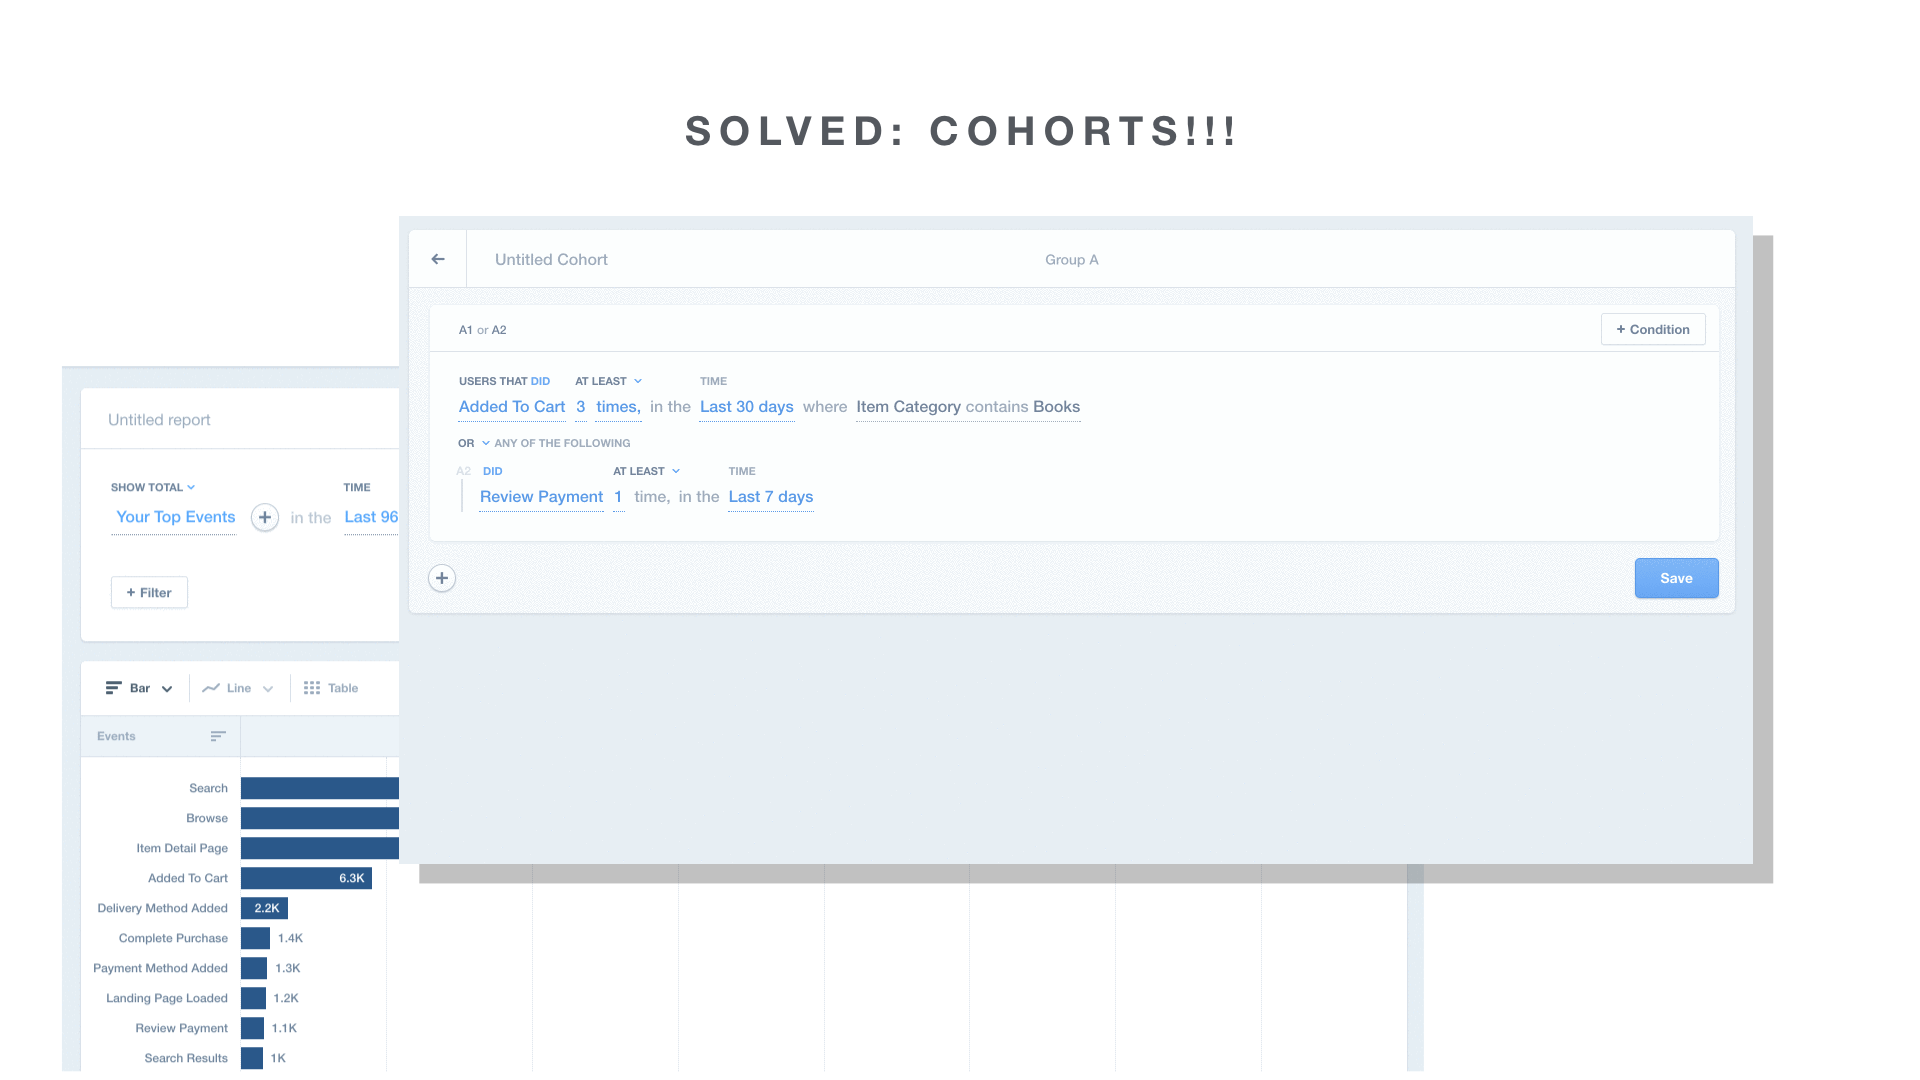
“By asking the question, “how fast can we get customers to validate that we have a solution?” we signal to the company what value we contribute. ”

Qualitative research synthesis board for Rollup Projects
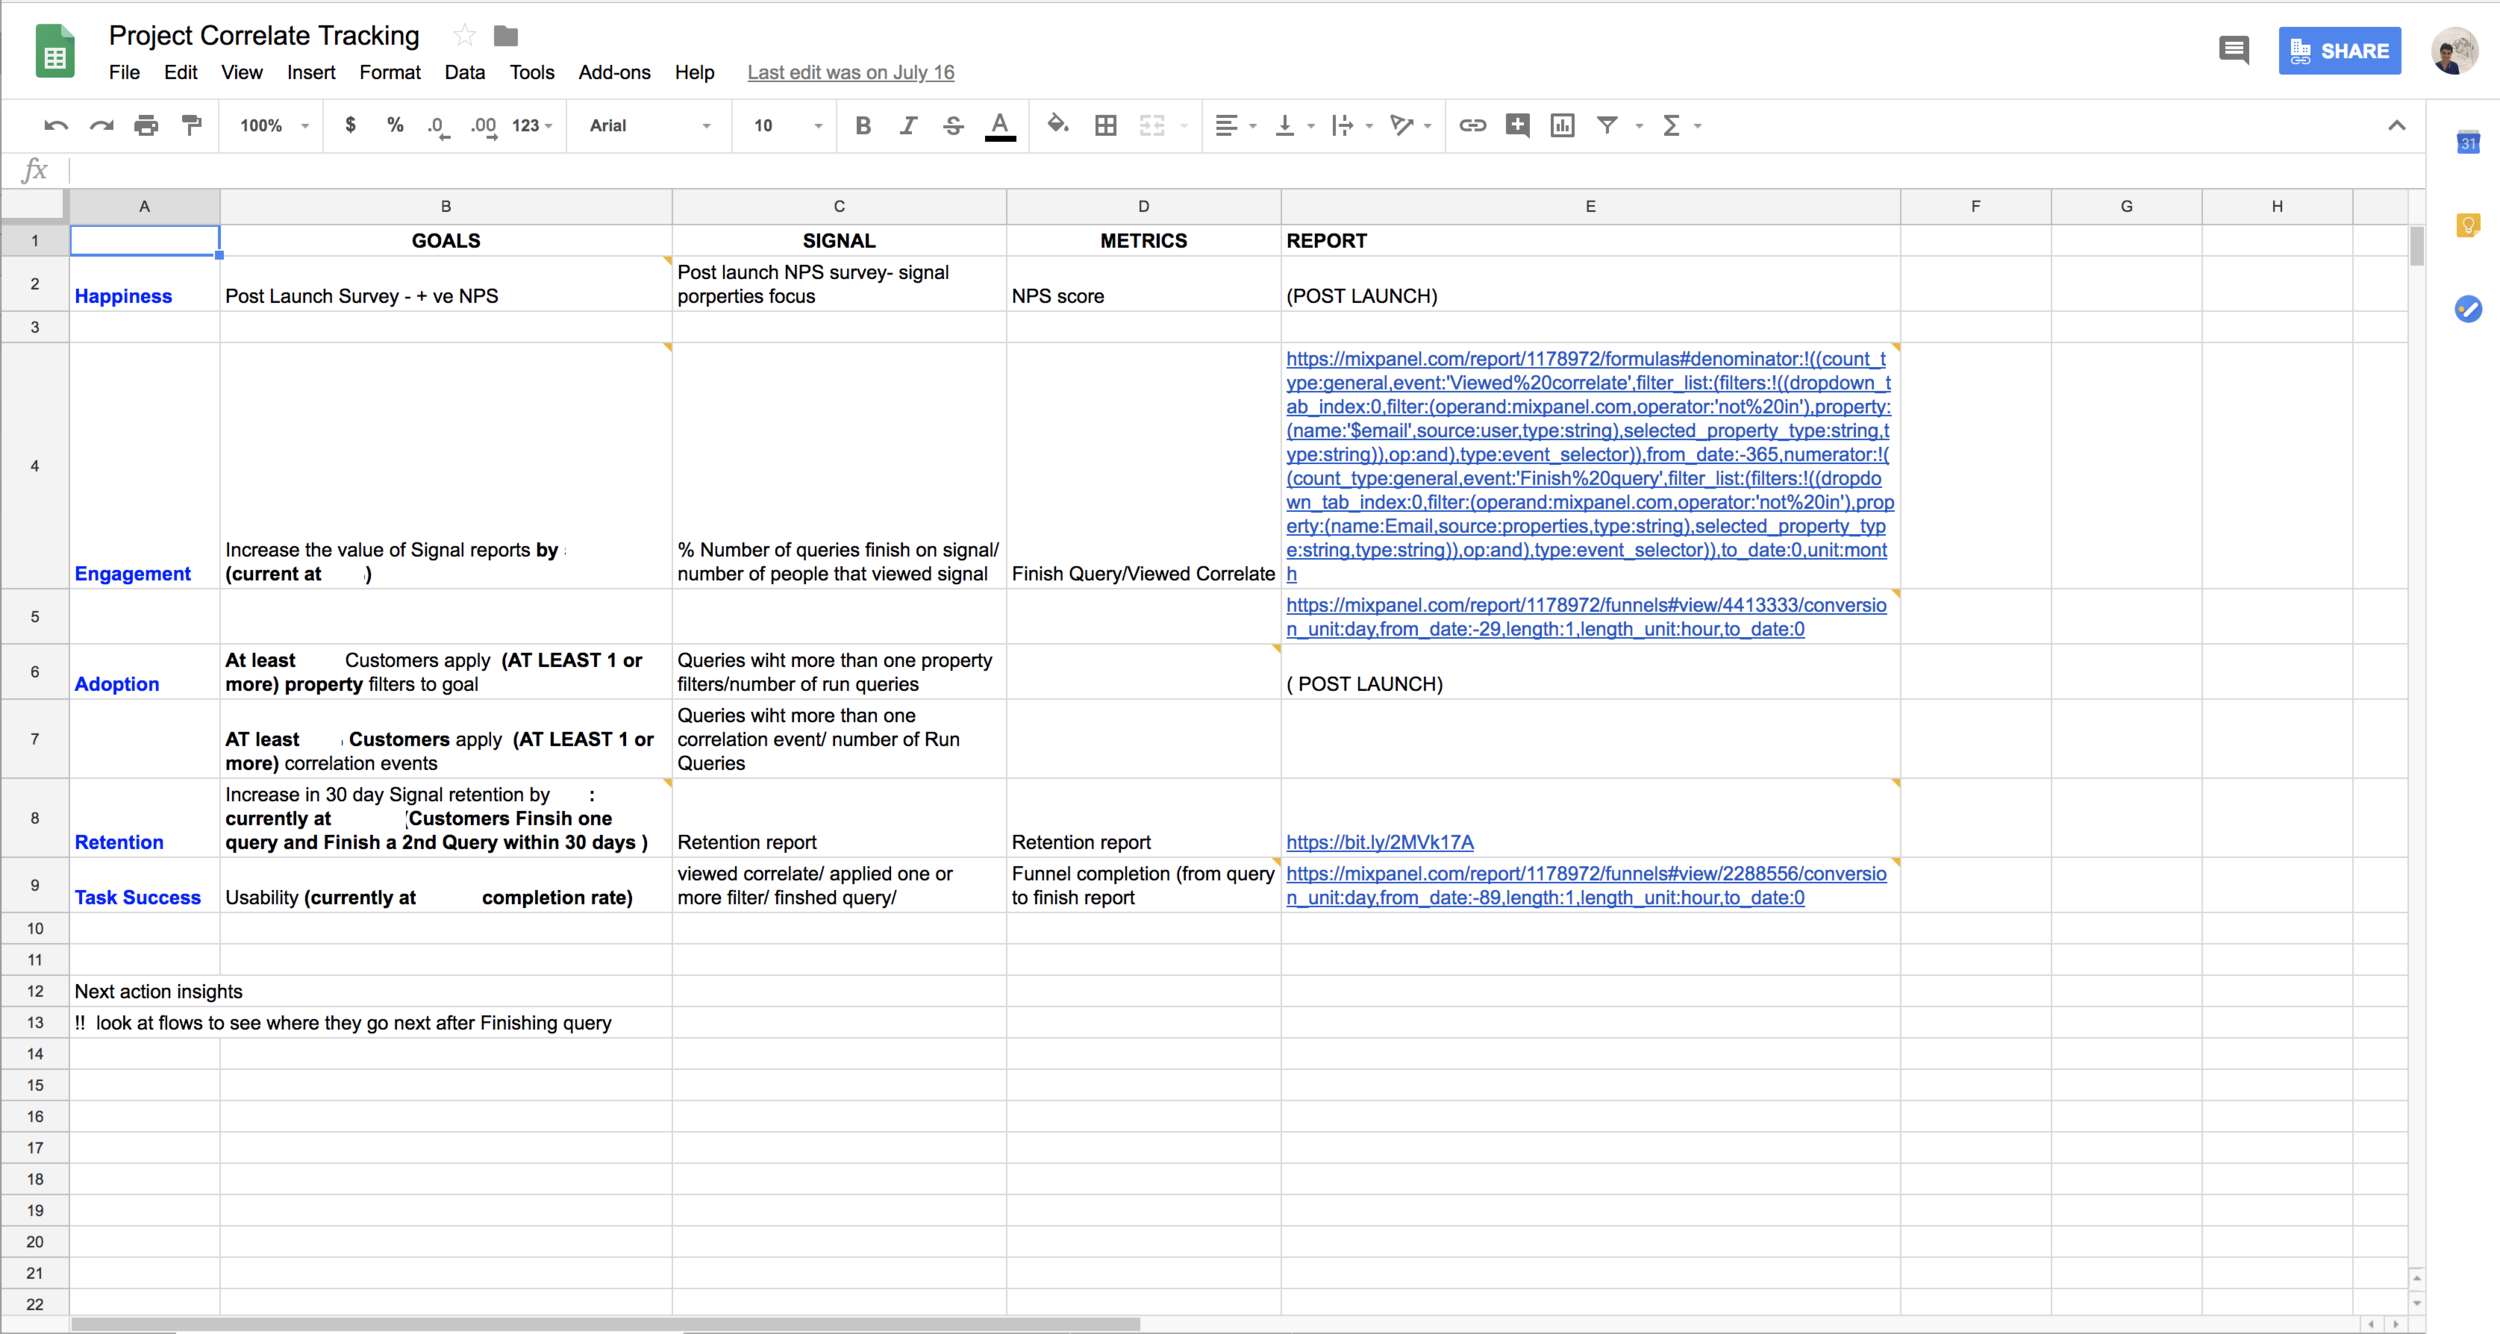
HEART Metrics spread sheet used to set our success metrics quant/qual for Signal (actual metrics redacted for protection of IP)
Speeding to Valuable Outcomes.
As part of our team rebuild, we put into place a core design principle to always be designing with data for data. In other words, ensuring you have a clear problem to solve that is backed by answers to “why?”, while striving for a series of success metrics that are agreed upon by the team. In short, the best practices of problem validation and solution validation.
Some practices that we were successful in implementing are as follows:
High-Velocity Synthesis: Using our research board modeled after Jessica Crabb’s wonderful contribution while at Pivotal Labs, we were able to gather feedback very quickly and synthesize on the fly
HEART Success Metrics: We use Google’s UX Metrics framework, H.E.A.R.T. early, throughout and right before release as a both a critical thinking rubric and a worksheet to define what success would mean on qualitative and quantitative dimensions.
Kano Model Followup Surveys
90-Day Observation periods of quantitative success metrics following release before projects are considered “done”
Measuring & Reporting Velocity
I learned the value of measuring velocity when I co-managed the product engineering team at StudioNow. It occurred to me at that time how similar design complexity and engineering complexity were, and subsequently, how design could benefit from adopting this practice. I’ve found the discipline of doing so to be as rewarding to the design team as it is informative to leadership. My favorite outcomes from doing so are:
It’s super lightweight
It signals to leadership a primary value that design delivers, reducing risk and complexity quickly
It provides a shared language to designers that serves as a shorthand for scoping conversations. This is a huge benefit when “pointing” as a team, saving days of time.
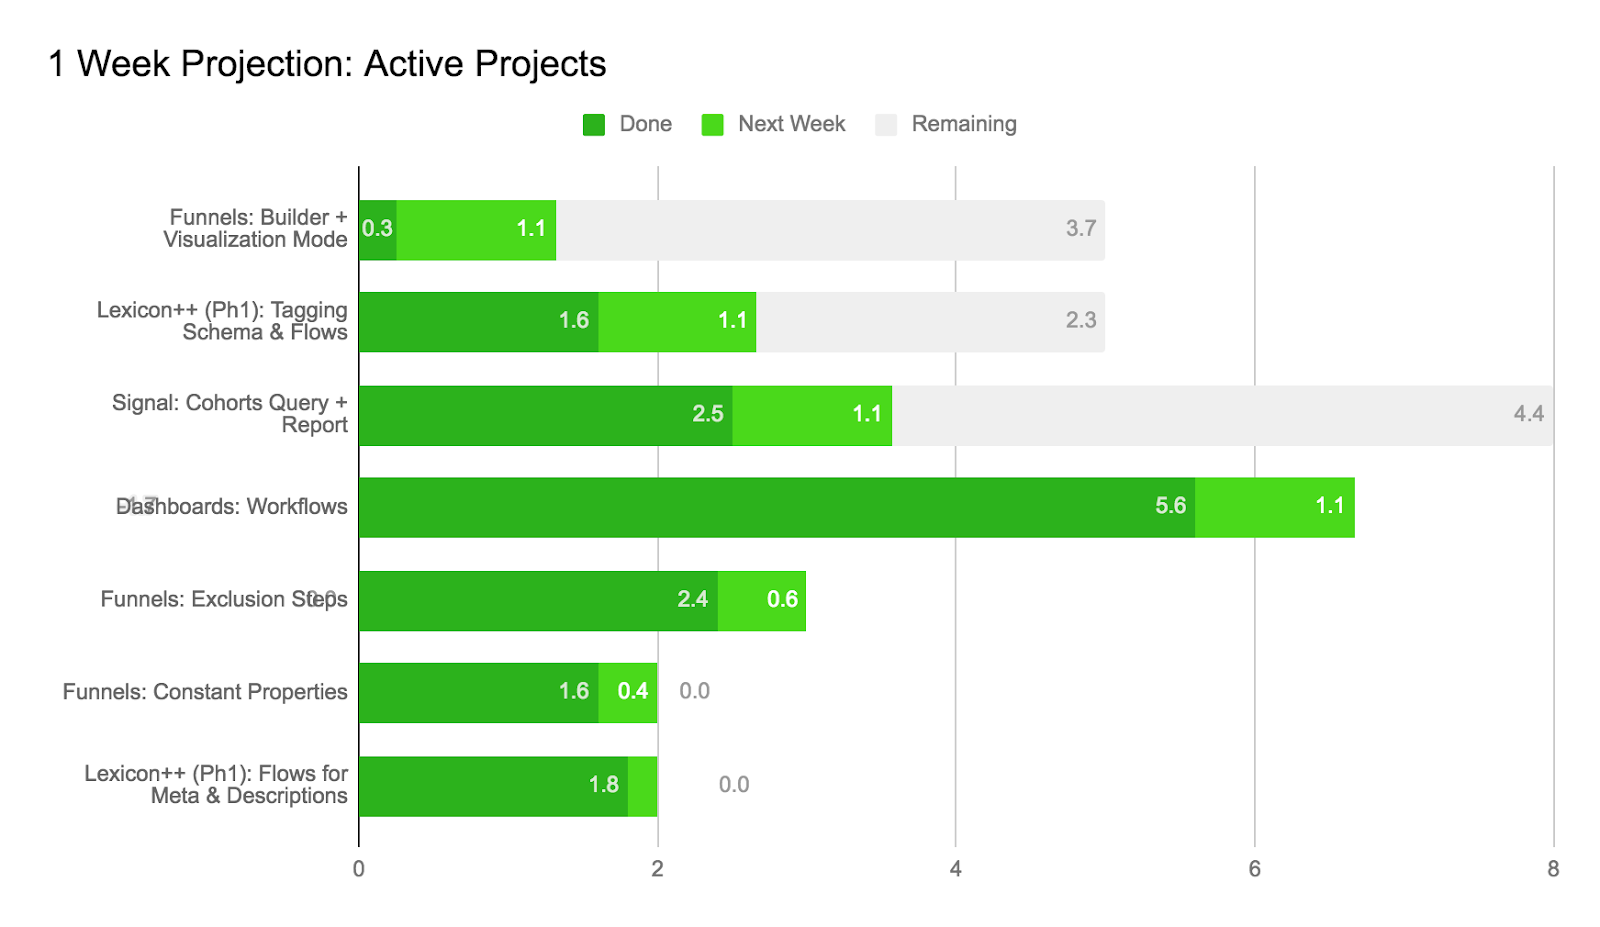
Velocity was measured by the speed at which projects were validated as “done” as signaled by customer feedback. Reporting velocity the entire Mixpanel EPD team every Friday gave the design team a regular cadence to celebrate contributions while serving to maintain our focus on the shared value of speed as goal that benefits everyone.
Some Results